
Jakobstad in 3D: the solar energy on every roof and the sun hours on every square metre
30 Sep
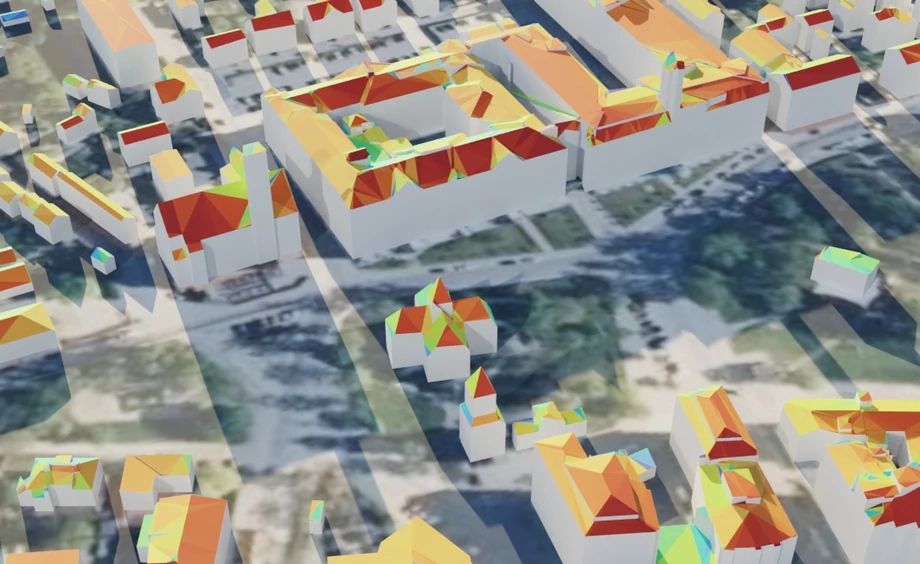
How much solar energy does your roof receive in a year, and will the yard of a new building sit in shade all December? We modelled 351 buildings in central Jakobstad in 3D down to their roof shapes and calculated the solar energy on every roof face and the sun hours on every half-metre square.
How much solar energy does your roof receive in a year? Will the yard of a new building sit in its neighbour's shadow all December? Does the evening sun reach the terrace at midsummer? These are everyday questions, yet the answers are surprisingly often guesses.
We wanted to show how precise the answers can be today. We modelled 351 buildings in central Jakobstad (Pietarsaari in Finnish), on Finland's west coast, in 3D down to their roof shapes. Then we calculated the annual solar radiation on every roof face and the hours of direct sunlight on every half-metre square of the town centre. This article covers what the results show and what they can be used for.
The challenge: the big picture can be right while the single number is wrong
Calculating solar energy and shadows is nothing new. Solar maps exist, and many design tools can draw shadows. But a result is only as good as its input. If a building is a box in the model, the south and north faces of a pitched roof merge into one flat surface. If the height of a building is an estimate, its shadow has the wrong length.
We saw this in our own comparisons. When building heights were estimated from the number of storeys and trees were missing, the town centre received on average about three hours too much direct sun per day. Solar energy showed the same effect on a smaller scale: from coarser input the average for the whole area came out almost the same, but the figure for an individual building could be off by up to 14 percent.
When the decision is about solar panels on one roof, or where to put the playground in one yard, the individual number is the one that matters.
The solution: a precise 3D model, down to the roof shapes
We built a model in which every roof face has its own slope, orientation and height. It is based on open data from the National Land Survey of Finland, which in central Jakobstad has about 7 measurement points per square metre. Density matters: at around 0.5 points per square metre, pitched roofs would have come out flat.
The same model comes in three levels of detail. The simplest is a block, the next splits a building into parts of different height, and the most detailed, known as LoD2.2, includes roof faces and ridges. Steep spires such as the church tower are modelled too. For solar energy and shade we used the most detailed level.
Key results
351 buildings in central Jakobstad as 3D models.
About 5 cm median deviation between the model and the measured data.
About 720 kWh of solar energy per square metre per year on the roofs on average, over 1,000 kWh on the best south facing roof faces.
More than 20 hours of sun above the horizon at the summer solstice, fewer than four in December.
Half-metre resolution in the sun hours: every yard, street and terrace on its own.
Under 10 minutes average difference in sun hours against measured heights, compared with about three hours when heights were estimated.
Trees are not drawn in the 3D images, but their shade is included in both the solar energy and the sun hours. Without trees, the results would look considerably sunnier than reality.
What the results can be used for
Placing solar panels
When every roof face has its own number, it is immediately clear where panels pay off and where they don't. A property owner can compare several buildings before asking for quotes.
Buildings that don't exist yet
The analysis works for a planned building too. Once the design is placed in the existing city model, you can see in advance how much sun the new roof will get, which parts of its yard will be in shade, and how it will shade its neighbours through the seasons. That helps as early as the sketch stage, while the building's shape, height and position on the plot can still change, and it supports zoning changes and conversations with neighbours.
Urban planning
Sun hours show where a yard, a playground or a terrace works best. A municipality can compare alternatives for a block before the detailed plan is fixed.
Municipal solar maps
A municipality can offer residents a map of the solar potential of their own roof. With precise data, the map also shows which roof face is best.
Visualisation
A 3D model is an easy way to show a plan to residents, decision makers or clients, and the same model can be used to study views.
Example: central Jakobstad
The test area was the town centre around the church. The solar energy calculation takes into account the slope and orientation of each roof face, shadows from buildings and trees, diffuse light from the sky and the weather of a typical year.
The difference that denser data makes is clearest at block level. Calculated from sparser data, the roofs are blurred patches. With dense data every ridge and fold is visible, and the shade on a north facing roof starts exactly at the ridge.
The figure is the radiation reaching the roof. The electricity a solar panel produces from it is typically about one fifth, depending on the panels, the mounting angle and the system. We estimate production separately once the panels and installation are known.
Sun hours follow the sun's actual path on a chosen day. The calculation is fast enough that a whole town can be computed at the same detail as a single block, and the results have been checked against an independent reference calculation.
Winter is different
At 63.7 degrees north, winter light is short and low. At the winter solstice the sun in Jakobstad climbs to about three degrees above the horizon at most, and almost all ground lies in the shadow of buildings or trees. That is why sun hours are worth calculating for both summer and winter. The summer result shows where it is pleasant to be outdoors; the winter result shows where snow lasts longest and which yards stay in shade all winter.
Frequently asked questions
How accurate is the result?
The median deviation of the 3D model from the measured data was about 5 cm in Jakobstad, and sun hours were calculated on a half-metre grid. Solar energy is a modelled value for a typical weather year, not a measurement, so the actual radiation in any single year can differ.
How old is the data?
The open data is updated region by region every few years. For Jakobstad it dates from summer 2021. Where there has been construction since, a drone survey brings the model up to date.
What do you deliver?
Typically maps as images, 3D models of the buildings, geospatial data that opens in the common GIS tools, and a short report with the figures by property or by roof face.
Can it be done outside Jakobstad?
Yes. The National Land Survey's data covers all of Finland. Before starting, we check how dense and recent the data is for the area.
How it works
Scope. We agree on the area and the questions: solar energy, shade, specific days or the whole year, existing or planned buildings.
Data. Open data from the National Land Survey of Finland or, when up-to-date information is needed, a 3D model from a Droneca drone survey.
3D model. Buildings are modelled down to their roof shapes and checked. Planned buildings are added to the model.
Analysis. Solar energy, sun hours or shadows for the times that matter.
Results. Maps, 3D models, geospatial data and a concise report.
Why Droneca
Droneca Oy is a company from Ostrobothnia, Finland, specialising in drone surveys and 3D modelling. We produce photogrammetry, orthophotos and 3D models for construction, property owners and municipalities. We can carry out the same analysis for any area in Finland, based on open data or on our own drone imagery.
Interested?
Would you like to know the solar potential or the shade on your property, block or planning area? Are you planning a new building or an extension? We can calculate the solar energy and shadows of a planned building before anything is built, and show how it affects its surroundings.
Contact us to discuss how we can help. Learn more at droneca.fi
Contains open data from the National Land Survey of Finland (CC BY 4.0).
Jakobstad in 3D: the solar energy on every roof and the sun hours on every square metre
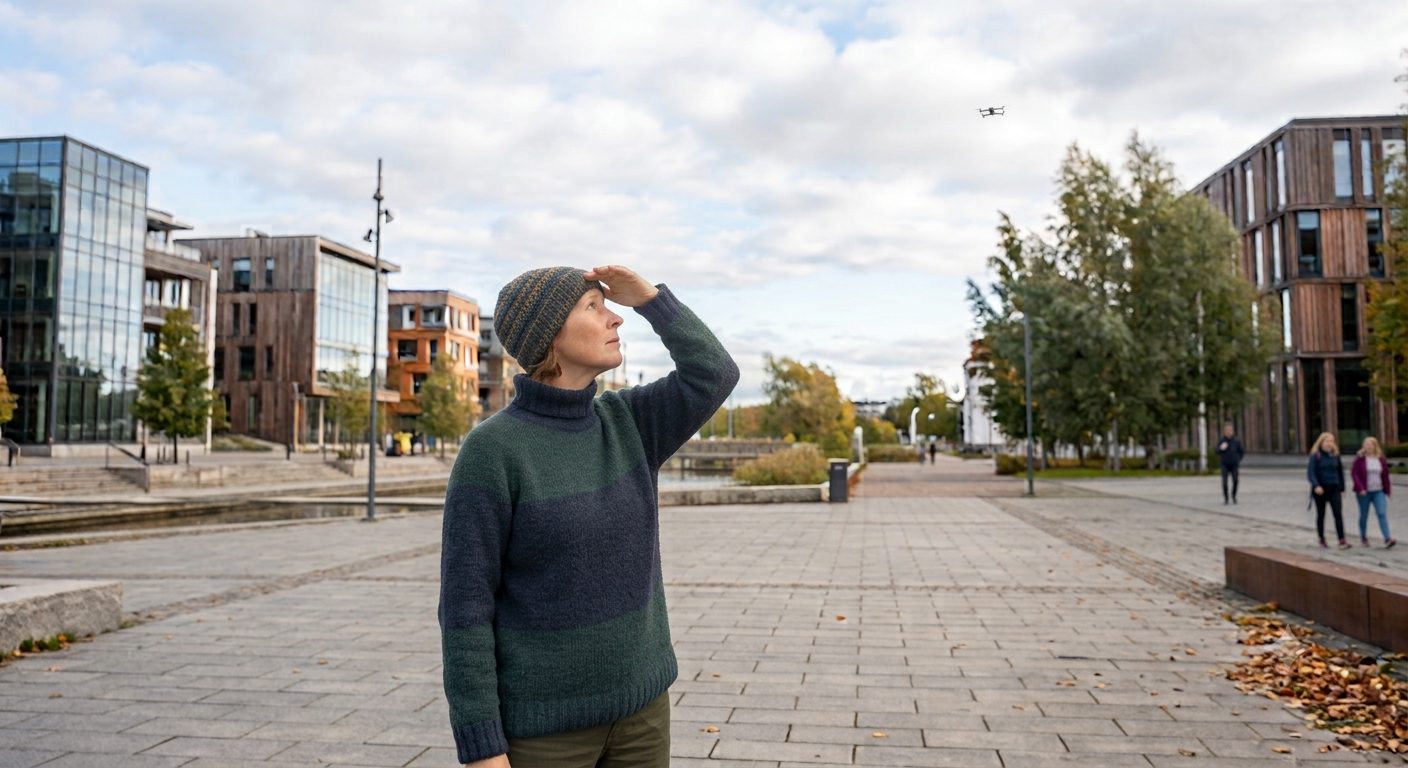
Drone in the sky – threat or just another working day?

What Buyers Need to Know About Drone Operator Certification in Finland
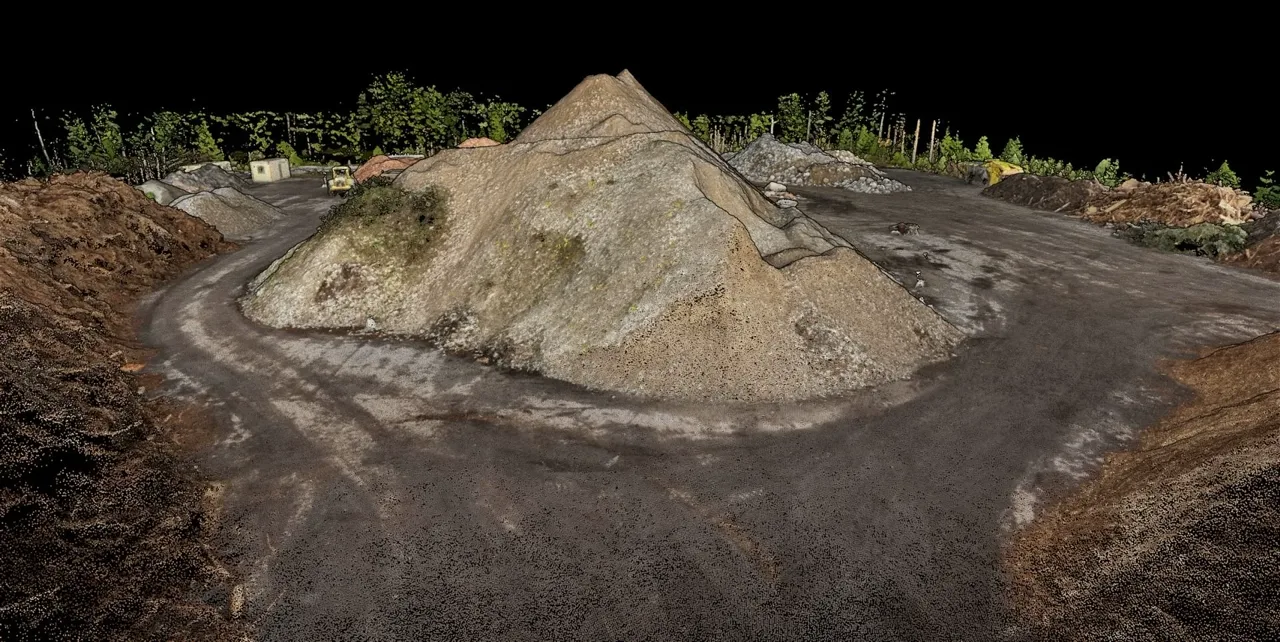
Case: Volume calculation of material piles with a drone - Over 51,000 m³ in a recycling area